Busting the Biggest Myth about Mutual Fund Investments: What You Really Need to Know

Pune, 09 October 2024: When it comes to mutual fund investments, many investors fall prey to a common misconception, especially regarding selecting schemes based solely on performance rankings.
Typically, new investors read a few articles online about one-year, three-year, or five-year returns and invest in the top-performing schemes. But one must realize that this is one of the biggest mistakes in mutual fund investing.
The Trap of Chasing Past Winners
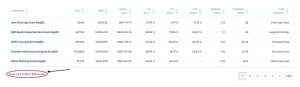
Let us discuss the numbers. We have compiled a table showing mutual fund schemes rankings over the last 15 years. Identifying schemes that were top performers in a particular year is easy.
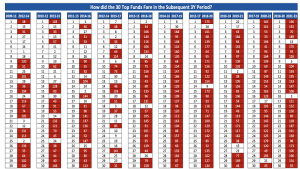
Source: FundsIndia
For instance, a top-ranked scheme in 2017 might seem like a rock-solid investment, but by 2020, that same scheme may have slipped to the 165th rank. That’s right—the once top-ranked scheme underperformed 164 other funds over just three years.
The broader message here is that chasing the winners of the past does not guarantee future success. In fact, history tells us that many top-performing schemes struggle to maintain their leadership position. So, if you had invested in the highest-ranked scheme in 2017, you would have earned far lower returns than if you had chosen one of the 164 schemes that outperformed it by 2020.
Isn’t it an Eye Opener? So, what is the solution?
A Better Approach to Mutual Fund Selection
How do you identify good mutual fund schemes without falling into the trap of chasing past winners?
At Definedge, we have developed an in-house mutual fund analysis platform called MFZone, which is equipped with a powerful mutual fund scanner. This tool allows you to filter mutual fund schemes based on key parameters so you can make an informed decision instead of solely relying on the past performance metric.
Hey Reader, Get this Scanner for FREE with a Definedge Securities Account.
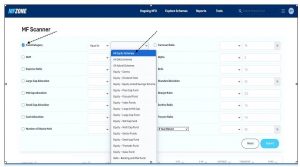
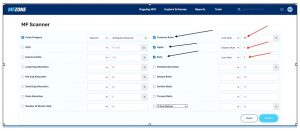
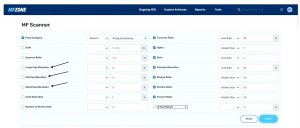
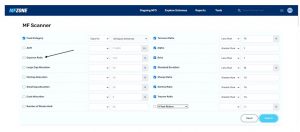
Let me explain how to use our Mutual Fund Scanner effectively. Since most of our readers are equity investors, let us begin by selecting “Equity Funds” as the scanner’s fund category.
Filtering with The Turnover Ratio
Next, look at the Turnover Ratio, which is an essential metric. The turnover ratio indicates how frequently a fund manager buys and sells stocks within the fund. For instance, if a fund started the year with 50 stocks and replaced 40 of them throughout the year, the turnover ratio would be 80%.
A high turnover ratio could suggest that the fund manager is constantly churning the portfolio, which can increase costs due to transaction fees and taxes.
We generally look for funds with a turnover ratio of less than 70%. This signifies that the fund manager has a stable investment approach and reduces unnecessary costs.
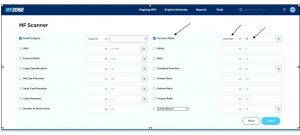
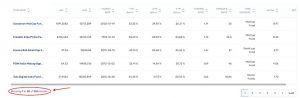
Based on Turnover Ratio criteria, the scanner shortlisted 346 schemes.
Ah, 346 schemes! Isn’t it too much?
Let us refine the selection further by applying additional criteria.
Applying Alpha and Beta Filters
We might have too many options once we have filtered equity schemes with a low turnover ratio. For example, our filter has yielded over 300 schemes, which is overwhelming.
To refine the selection further, let us introduce two additional metrics: Alpha and Beta.
Alpha measures the excess return a fund generates compared to its benchmark. For instance, if a large-cap equity fund returns 20%, and the Nifty 50 (its benchmark) returns 18%, the alpha, in this case, would be 2%.
We look for funds with positive alpha, which indicates they outperform their benchmarks.
Beta measures a fund’s sensitivity to market movements. If a fund’s beta is 1, it indicates that the scheme’s performance is in tandem with the market.
A beta greater than 1 suggests the fund is more volatile than the market, while a beta less than 1 indicates it is less volatile.
Ideally, we look for funds with a beta lower than 1, as these tend to be relatively less risky in volatile markets.
We will essentially look for and identify schemes with an Alpha greater than 1, which indicates that the scheme has outperformed its benchmark. Along with the Alpha filer, we shall also look for ones with a Beta of less than 1, providing a margin of safety in case the markets decline, as these schemes tend to be less volatile than the market.
Adding the Alpha and Beta filters has reduced the number of schemes to 250.
But are you ready to invest in 250 schemes? Probably not, right?
To narrow it even further, we can apply the next filter: Standard Deviation and Risk Parameters.
Standard Deviation and Risk-Adjusted Ratios
Standard Deviation measures a fund’s return volatility. A lower standard deviation indicates more stable returns. To ensure stability in our portfolio, let us aim for low-volatility funds.
For investors seeking long-term mutual fund schemes, the standard deviation should ideally be less than 10% to ensure lower volatility and more stable returns.
But we don’t stop there. We can also apply three critical Risk-Adjusted Return Ratios: the Sharpe Ratio, the Sortino Ratio, and the Treynor Ratio. These ratios help us compare a fund’s return in relation to the risk undertaken.
Let us understand these ratios.
The Sharpe Ratio compares the fund’s return to the risk-free rate, adjusted by the fund’s volatility (standard deviation). A Sharpe Ratio of greater than 1.5 is considered good.
The Sortino Ratio is similar to the Sharpe Ratio but only considers downside volatility (negative returns), which makes it more precise for risk-averse investors. Again, we look for a ratio of more than 1.5.
The Treynor Ratio takes beta into account, measuring the fund’s return compared to market risk. Like the others, a Treynor Ratio greater than 1.5 is desirable.
We have now significantly narrowed down our options by filtering schemes with a Standard Deviation of less than 10% and Sharpe, Sortino, and Treynor Ratios greater than 1.5.
Here is the result:
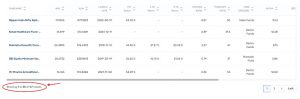
If you recall, we started off with 346 schemes and have now narrowed it down to just 57 schemes.
Tailoring to Your Risk Appetite: Small, Mid, and Large-Cap Allocations
At this point, you may still have around 57 schemes, which is relatively manageable but still a broad list. Now, it’s time to consider your risk tolerance and investment goals.
For example, if you have a higher risk appetite and want exposure to small-cap or mid-cap stocks, you can adjust the scanner to show funds with at least 15% allocated to small-cap stocks and 10% to mid-cap stocks.
For more conservative investors who prefer large-cap stability, you can filter for schemes with over 50% allocation to large-cap stocks.
Final Filters: Expense Ratio
Lastly, the Expense Ratio is one of the most overlooked factors in mutual fund selection. This is the annual fee the fund charges its investors, and it can significantly impact your returns over time. Use the scanner to sort funds by the lowest expense ratio. This helps in minimizing cost and thereby enhancing returns.
Choosing the Right Mutual Fund with Confidence
Investing in mutual funds should not just be about chasing last year’s winners. It’s about understanding the key metrics discussed in this post and applying thoughtful filters to find a fund the ones that aligns with your goals and risk tolerance.
At Definedge, our Mutual Fund Scanner simplifies this entire process, allowing you to analyse funds based on important criteria like turnover ratio, alpha, beta, risk-adjusted returns, and more.
By following this approach, you can confidently select mutual funds that can potentially perform well over the long term. Use this scanner every six months to adjust your portfolio as needed, ensuring you stay on track with your financial goals.
Disclaimer: The purpose of this article is only to share interesting charts, data points and thought-provoking opinions. It is NOT a recommendation. This article is strictly for educative purposes only.
As per SEBI guidelines, the writer and his dependents may or may not hold the stocks/commodities/cryptos/any other assets discussed here. However, clients of Definedge may or may not own these securities.