Broader Markets: The Next Frontier?

By Brijesh Bhatia (@bbrijesh9) and B.Krishnakumar (@Techtrail)
Pune, 13th October 2024: Is the BULL RUN OVER in the Indian stock market after two straight weeks of the Nifty closing in the red?
Concern is growing among investors and traders. However, the market’s narrow range in the last week suggests that volatility might be cooling off, hinting…
Following a sharp decline of nearly 5.5%, the Nifty 50 bulls seem to have found their plot in the 24,600-24,700 range. What stands out, however, is the relative strength of the broader markets over the last few days. This shift presents a potential opportunity for readers to focus on midcap and small-cap stocks, where potential gains could be on the horizon.
What convinces us to focus on the broader markets?
To answer this, let us take a closer look at the market’s breadth and the relative performance of various segments.
{Get this Free book with Definedge Securities Account – Outperforming the Markets Using Relative Strength and Breadth Analysis – by Prashant Shah, to learn more about relative strength and breadth analysis}
Source: Zone, Definedge Securities
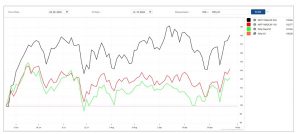
The ratio chart comparing the Nifty 450 universe (Nifty 500 minus Nifty 50) with the Nifty 50 index clearly highlights that the Nifty SmallCap 250 index has outperformed both the Nifty 50 and the midcap and Next 50 segments.
Source: Zone, Definedge Securities
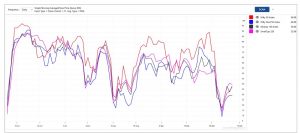
The chart above shows the percentage of stocks trading above their 21-day exponential moving average across the four segments of the Nifty 500 universe. Here, both the SmallCap 250 and MidCap 150 indices have outperformed their large-cap counterparts, indicating that broader market participation also supports improved performance.
Finally, let us also look at the individual price chart and compare it with the ratio chart.
Source: Zone, Definedge Securities
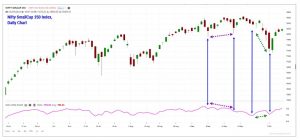
In the chart above, there are two sets of vertical blue arrows. The first set, marked with dashed purple arrows, highlights a negative divergence, signalling a potential issue for the SmallCap 250 index. While the price didn’t break the previous swing low, the ratio line (shown in the lower pane) made a lower low.
In contrast, the green arrows indicate a positive divergence—where the price made a lower low, but the ratio line made a higher low—signifying strong outperformance. Finally, let’s examine whether a boost in momentum also accompanies this improvement in relative performance and breadth.
Source: Zone, Definedge Securities
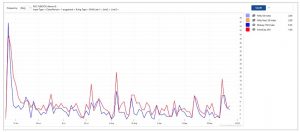
The chart above shows the percentage of stocks in the midcap and small-cap indices that have gained 4% or more. It’s encouraging to see that this metric has improved over the past few days despite a recent dip. The significant spike, aligning with the positive divergence in the ratio chart, is a positive signal on its own.
Focusing on the midcap and small-cap segments for entry opportunities makes sense, with relative performance, breadth, and momentum pointing to strength in the broader markets. If the Nifty 50 index moves higher, these segments may potentially outperform.
Disclaimer: The purpose of this article is only to share interesting charts, data points and thought-provoking opinions. It is NOT a recommendation. This article is strictly for educative purposes only.
As per SEBI guidelines, the writer and his dependents may or may not hold the stocks/commodities/cryptos/any other assets discussed here. However, clients of Definedge may or may not own these securities.
(About the authors: Brijesh Bhatia has over 18 years of experience as a trader and technical analyst in India’s financial markets. He has worked with UTI, Asit C Mehta, and Edelweiss Securities. He is currently a Senior Research Analyst and editor at Definedge.
B.Krishnakumar has a background in commerce and has been trading and tracking stock markets since 1994. Before joining Definedge, he worked for The Hindu Business Line & Dow Jones Newswires. He is passionate about teaching and simplifying concepts.)