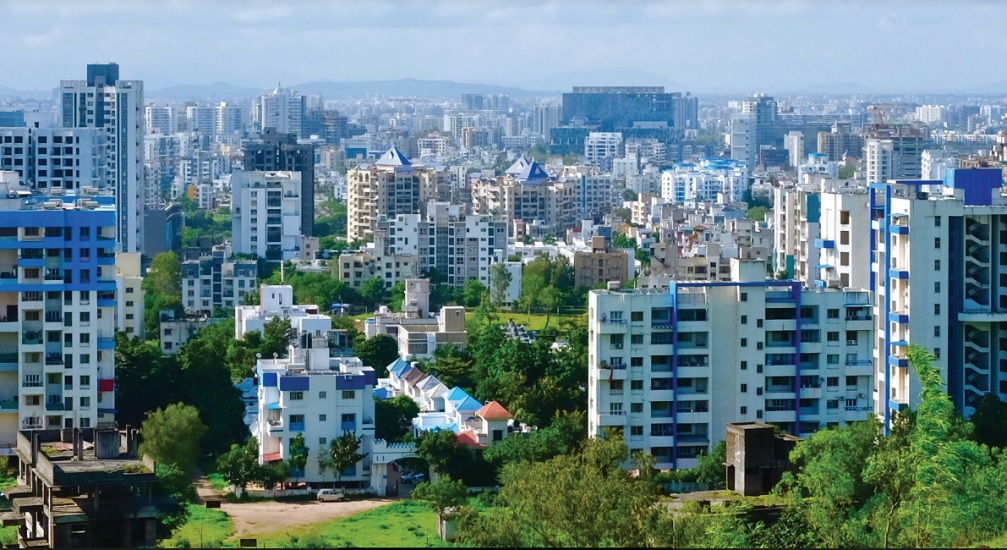
Pune Achieves Record High Property Registrations, Stamp Duty Collection in March 2025

Pune, 23rd April 2025: Knight Frank India, in its latest report, noted that Pune’s real estate market saw a record-breaking performance in March 2025, registering over 24,430 property deals collecting INR 924 crore (cr) in stamp duty. This marks the highest monthly figures for both registrations and revenue collections since 2022, supported by strong demand and high-value transactions.
Compared to the previous month, property registrations increased by 28%, while stamp duty collections rose by 30%. The surge is attributed to stable economic conditions, infrastructure momentum, and robust homebuyer sentiment. Pune’s relative affordability, especially when compared to other major metros, continues to draw consistent housing demand.
Property registrations, Value of property and Stamp duty collection
| Year | Month | Total Registration | Stamp Duty Collection
(INR Cr) |
| 2024 | January | 17,786 | 589 |
| 2024 | February | 18,791 | 662 |
| 2024 | March | 22,189 | 822 |
| 2024 | April | 14,244 | 566 |
| 2024 | May | 12,280 | 440 |
| 2024 | June | 14,690 | 545 |
| 2024 | July | 13,731 | 521 |
| 2024 | August | 13,645 | 599 |
| 2024 | September | 11,056 | 508 |
| 2024 | October | 20,894 | 751 |
| 2024 | November | 13,371 | 475 |
| 2024 | December | 17,348 | 620 |
| 2025 | January | 17,449 | 638 |
| 2025 | February | 19,025 | 713 |
| 2025 | March | 24,439 | 924 |
Source: Knight Frank Research, Maharashtra Govt- Dept. of Registrations and Stamps (IGR)
Property registration and Stamp duty collection
| Period | Registrations (Units) | Stamp duty collection (INR cr) |
| Mar-24 | 22,189 | 822 |
| Mar-25 | 24,430 | 924 |
| YoY Change | 10% | 12.4% |
| Demand for homes priced INR 1 cr and above surged in Mar 2025 |
Homes priced above INR 1 cr continued to gain traction, with their share rising from 14% in March 2024 to 15% in March 2025. This reflects a growing preference for premium homes among Pune’s homebuyers.
Share of ticket size for residential property transactions
| Ticket size | Share in Mar 2024 | Share in Mar 2025 |
| Under INR 25 lakhs | 21% | 20% |
| INR 25 – 50 lakhs | 32% | 32% |
| INR 50 lakhs – 1 Cr | 33% | 33% |
| INR 1 Cr – 2.5 Cr | 13% | 13% |
| INR 2.5 Cr – 5 Cr | 1% | 2% |
| Over 5 Cr | <=1% | <=1% |
Source: Knight Frank Research, Maharashtra Govt- Dept. of Registrations and Stamps (IGR)
Shishir Baijal, Chairman and Managing Director, Knight Frank India said, “Pune’s real estate market has demonstrated remarkable growth in March 2025, driven by robust end-user demand, attractive affordability, and a conducive business ecosystem. The increasing preference for larger homes reflects consumer priorities toward lifestyle and long-term value. Notably, on a YoY basis, Pune’s residential market recorded a 7% increase in revenue collection in Q1 2025 (Jan – Mar 2025) compared to the same period last year. The recent softening of interest rates further strengthens the outlook, encouraging both new buyers and upgraders to act. The long-term growth momentum of the city’s residential appears strong backed by continued growth of the city and robust infrastructure developments.”
| Higher demand for larger apartments sustains |
The demand for larger apartments remains strong, reiterating the demand for spacious homes in the post-pandemic era, with the share of units exceeding 800 square feet (sq ft) rising from 24% in March 2024 to 29% in March 2025.
Share of area for residential property transactions
| Area in sq ft | Share in Mar 2024 | Share in Mar 2025 |
| Under 500 | 35% | 26% |
| 500-800 | 41% | 45% |
| 800-1000 | 11% | 13% |
| 1000- 2000 | 12% | 13% |
| Over 2000 | 1% | 3% |
Source: Knight Frank Research, Maharashtra Govt- Dept. of Registrations and Stamps (IGR)
| Central Pune contributed 76% of residential transactions in Mar 2025 |
In March 2025, Central Pune—including Haveli Taluka, Pune Municipal Corporation (PMC), and Pimpri Chinchwad Municipal Corporation (PCMC)—maintained its lead in residential transactions, accounting for 76% of the market. However, this represented a slight decline from the previous year as emerging developments in other parts of the city catered to evolving homebuyer preferences. West Pune, which includes Mawal, Mulshi, and Velhe, held the second-largest share at 12%, while North, South, and East Pune collectively contributed 11% of transactions during the same period.
Share of micro markets for residential property transactions
| Micro market | Share in Mar 2024 | Share in Mar 2025 |
| North | 5% | 6% |
| South | 3% | 4% |
| East | 2% | 1% |
| West | 12% | 12% |
| Central | 78% | 76% |
Source: Knight Frank Research, Maharashtra Govt- Dept. of Registrations and Stamps (IGR
| Micro Markets | |
| Zone | Taluka |
| North | Junnar, Ambegaon, Khed |
| South | Bhor, Purandhar, Baramati, Indapur |
| East | Shirur, Daund |
| West | Mawal, Mulshi, Velhe |
| Central | Haveli, Pune city (Pune Municipal corporation (PMC) & Pimpri Chinchwad Municipal Corporation (PCMC)) |


