Yet Another Buying Opportunity?

Pune, 05 October 2024: The Indian stock market, represented by the Nifty 50 index, has recently encountered its sharpest weekly drop of 4.45% for the first time since June 2022. As the index tumbles, the question looms—will the bearish sentiment persist, or is it time to buy the dip?
Recently, the Indian markets have displayed this tendency to snap back quickly after a brief fall, making India one of the best-performing indices among the emerging markets. But the current market scenario feels different.
The Global Shift: China Rebounds
One of the key factors influencing investor sentiment is the changing global economic landscape. With the Chinese economy slowly regaining its footing and the People’s Bank of China (PBOC) cutting interest rates on September 27, 2024, foreign investors are starting to spot opportunities in China. For many Foreign Institutional Investors (FII), China’s market appears to be relatively more attractive on the basis of relative valuation and safety margin compared to the Indian markets. The narrative that Indian equities are overvalued is gaining traction, and consequently, FII is seen shifting funds toward China.
The numbers tell the story. In just the first three trading days of October 2024, FIIs sold a staggering Rs.30,719 crores worth of equities, compared to a relatively modest Rs.12,611 crores in buying throughout September.
Alarm bells are ringing, but should Indian investors be worried?
A New Era for Indian Investors
A decade ago, FII selling would have likely triggered a full-blown panic, but today’s India is different. Indian investors have matured and evolved. Gone are the days of parking funds solely in safe Fixed Deposits (FDs). The modern Indian investor is taking a more calculated risk, shifting towards Mutual Funds (MFs) and equities, reflecting a growing confidence in the domestic economy and the broader ‘New India’ narrative.
This evolution is evident in the data. Since March 2020, FIIs have been net sellers in Indian equity markets to the tune of Rs.4,29,905 crores. In stark contrast, domestic institutional investors (DIIs) have been net buyers, pouring in Rs.8,39,889 crores. This signals a structural shift wherein there is lesser influence of foreign funds in dictating domestic market trends.
What Do the Nifty Charts Say?
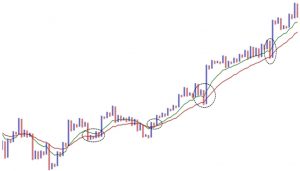
Source: Tradepoint, Definedge
From a technical perspective, the Nifty is standing at a crucial juncture. On the Nifty Daily 0.25% X 3 Point & Figure chart, the index is perched on the edge of a significant fall, having dropped more than 1,300 points from its all-time high of 26,277.
What is a P&F Chart?
A point-and-figure chart is an objective chart method using X’s and O’s. The X denotes bullish moves, while O denotes bearish moves. Unlike traditional time-based charts, P&F charts focus solely on price changes and are considered “noiseless.” They filter out minor price fluctuations, highlighting significant trends and reversals. The lack of time constraints gives a clearer picture of supply and demand dynamics, helping chartists make more informed decisions.
You can learn more about the P&F Charts Video here.
However, the recent fall was on the back of an impressive rally from the 24,900 level to 26,277. This one-sided rally manifests itself as an Anchor column in the Point & Figure Chart. An anchor column is a lengthy column of X or O which typically is printed when there is a strong trend and momentum. An Anchor column consists of a long column of either ‘X’ or ‘O’ with more than 15 boxes, a concept popularised by Prashant Shah in his renowned book on point-and-figure charts. If you have a Definedge Securities account, access this book for free on the Shelf.
Despite the current pullback, history suggests that such corrections often present buying opportunities. The chart’s 10-column and 20- column averages, which stand at 24,642 and 23,813, respectively, have consistently acted as support zones during market dips. Since Nifty’s rally from the 16,000 level, dips to these moving averages have proven to be strategic buying points for savvy investors.
Should You Buy the Dip?
As the Nifty teeters on the edge, this may well be another instance where caution turns into opportunity. For Indian investors, the current correction could be a chance to accumulate stocks at more attractive valuations. Domestic sentiment remains strong, and while FII flows may be volatile, the underlying belief in India’s growth story is unwavering.
The real question is, are you prepared to buy the dip?
In times of uncertainty, the Indian market has repeatedly shown that corrections can often lead to renewed strength and rally. With the backbone of domestic investment standing strong, this could be the perfect time for investors to take a fresh look at their portfolios and seize the opportunities.
Stay optimistic, stay invested, and remember—the market always rewards patience and conviction.
Disclaimer: The purpose of this article is only to share interesting charts, data points and thought-provoking opinions. It is NOT a recommendation. This article is strictly for educative purposes only.
As per SEBI guidelines, the writer and his dependents may or may not hold the stocks/commodities/cryptos/any other assets discussed here. However, clients of Definedge may or may not own these securities.