Everything is Bullish. What’s Next?

Pune, 29th September 2024: The Nifty50 index has been on an upward trajectory since March 2023 and has not crossed the psychological 26,000-level. The most obvious question in most people’s mind would be what’s next for the market?
This rally reminds me of a famous line from the movie Scam 1992 – “India will also stand, with a 56-inch chest, to look into the world’s eye. Invest in India because India’s rate is going to grow.” We are witnessing another surge 30 years after Harshad Mehta’s infamous bull run. The question is, are you part of this bull run?
But why is this discussion relevant now?
If you have seen the recent data released by SEBI, systematic traders and algo are making profits, and the market rewards disciplined traders.
You can be one of them by using the objective chart method called Point & Figure (P&F).
What is a P&F Chart?
A point-and-figure chart is an objective chart method using X’s and O’s. The X denotes bullish moves, while O denotes bearish moves. Unlike traditional time-based charts, P&F charts focus solely on price changes and are considered “noiseless.” They filter out minor price fluctuations, highlighting significant trends and reversals. The lack of time constraints gives a clearer picture of supply and demand dynamics, helping chartists make more informed decisions.
You can learn more about the P&F Charts Video here.
Nifty50 Point & Figure Chart
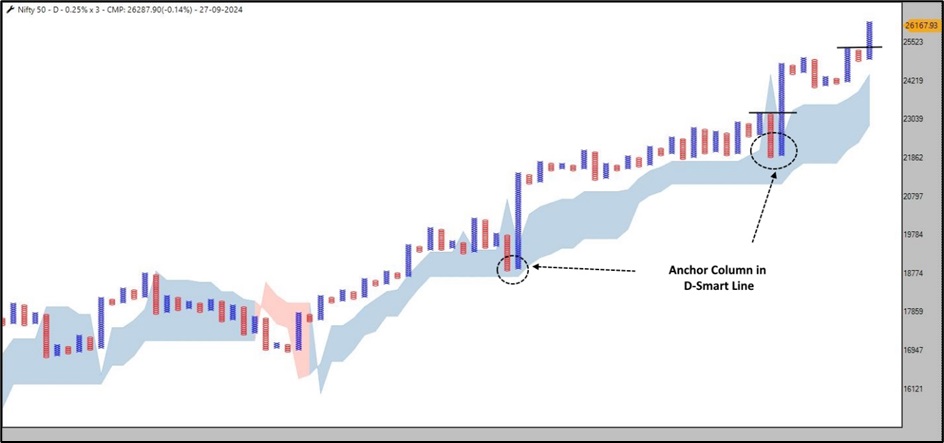
Source: Tradepoint, Definedge Securities
The above Point & Figure (P&F) chart of Nifty is plotted using a 0.25% box size and a 3-box reversal. It is apparent from the chart that the index has been in a steady up trend, marked by a series of double-top-buy patterns, which is a bullish swing breakout pattern in P&F charts.
The index is trading above the D-Smart Line—a proprietary signal from Definedge—indicating that bulls are in firm control. Read more about the indicator.
An anchor column pattern with a strong bullish move from the D-Smart Line indicates that bulls are looking for opportunities when the market dips. As we highlighted, the traders looking for “aur kitna jayega” are missing the trend, while the objective and systematic traders are making the most of the recent bull run.
What’s Next?
The current market rally has witnessed frequent sector rotation. Focusing on sector rotation is key to staying ahead as a trader, and it’s how the smartest traders position themselves in the top 1% of the market.
DeMAP, A tool for Sector Rotation
Sector rotation refers to the shift in market leadership as investors move their capital from one sector to another. Definedge has developed a powerful tool called DeMAP (Definedge Momentum and Performance) to help traders track these rotations and make informed decisions.
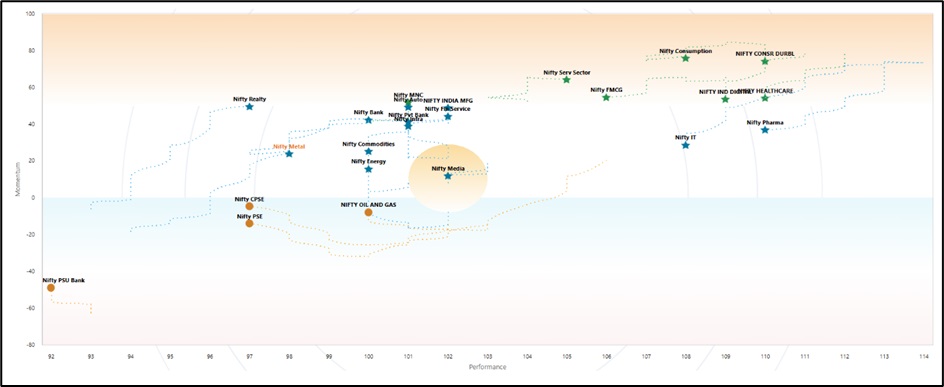
Source: RZone, Definedge Securities
DeMAP is a comprehensive market analysis tool that integrates price analysis, momentum indicators, relative strength, and multiple charting techniques like Point & Figure, Renko, and candlesticks. The tool categorises stocks into two sections: Sky and Water. Above the zero line, stocks in the Sky section are bullish, represented as stars. Stocks in the Water section—below the zero line—are bearish, represented as circles. You can watch the video or read about DeMAP in detail.
Where Should Traders Focus Now?
Currently, sectors like Metals, Real Estate, and Banks are moving towards outperformance. Among these, the Metals sector looks particularly promising. With stocks resuming their bullish rally, traders should pay close attention to this space.
All Chart Matrix: A Key to Top-Down Approach
As we selected the sector using DeMAP, it’s time to find the stocks within the metals space that are bullish using the multi-charting method.
Definedge has a unique feature called the All-Chart Matrix, simplifying trading decisions by quantifying technical studies. This feature compiles data from multiple chart types across different timeframes and assigns scores based on price action—1 for bullish and 0 for bearish. The aggregate score allows traders to identify bullish or bearish stocks quickly.
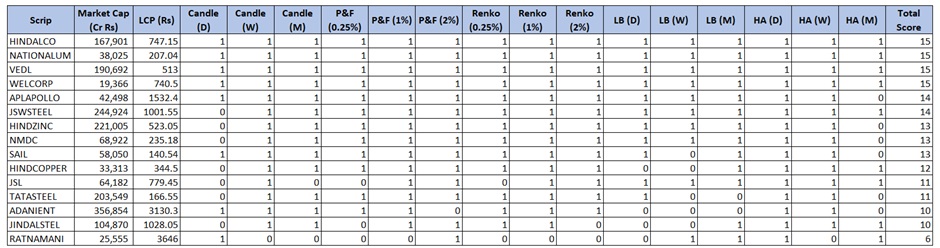
Source: RZone, Definedge Securities
For October, stocks like Hindalco, National Aluminium, Vedanta (VEDL), and Welcorp are leading the Nifty Metal Index in terms of bullish momentum. These stocks have high scores on the All Chart Matrix and should be on every trader’s watchlist.
To conclude, the market is bullish, but systematic and informed trading is key to taking advantage of this rally. Tools like DeMAP and the All Chart Matrix offer traders invaluable insights into sector rotation and stock performance, helping them stay ahead of the curve. As October unfolds, the Metals sector presents a promising opportunity, and it’s up to smart traders to seize it.
Disclaimer: The purpose of this article is only to share interesting charts, data points and thought-provoking opinions. It is NOT a recommendation. This article is strictly for educative purposes only.
As per SEBI guidelines, the writer and his dependents may or may not hold the stocks/commodities/cryptos/any other assets discussed here. However, clients of Definedge may or may not own these securities.