Pune’s Residential Sales Volume Rose By 17% YoY: Knight Frank India
Pune, 10th January 2023: Knight Frank India today launched the 18th edition of its flagship half-yearly report – India Real Estate, July – December 2022 – which presents a comprehensive analysis of the residential and office market performance across eight major cities for the July-December 2022 (H2 2022) period. In this latest report, it is noted that Pune’s residential market witnessed substantial growth in the sales volume by 17% YoY in the calendar year (CY) 2022, recording 43,410 housing units in the year. Whereas Pune’s annual office leasing increased by 61% YoY to 6.2 million square feet (mn sq ft).
RESIDENTIAL MARKET HIGHLIGHTS OF PUNE
In 2022, Pune recorded the best residential sales since 2013. Homebuyers’ outlook remain optimistic despite consecutive mortgage rate hikes and additional 1% metro cess which affected the consumers’ purchasing capacity. However, the annual launches in Pune witnessed a marginal decline of 5% YoY accounting to 38,640 units.
In 2022, Pune recorded the best residential sales since 2013. Homebuyers’ outlook remain optimistic despite consecutive mortgage rate hikes and additional 1% metro cess which affected the consumers’ purchasing capacity. However, the annual launches in Pune witnessed a marginal decline of 5% YoY accounting to 38,640 units.
PUNE RESIDENTIAL MARKET SUMMARY
| Parameter | 2022 | 2022 Change (YoY) | H2 2022 | H2 2022 Change (YoY) |
| Launches (housing units) | 38,640 | -5% | 21,247 | 6% |
| Sales (housing units) | 43,410 | 17% | 21,613 | 9% |
| Average price in INR/sq m (INR/sq ft) | INR 46,204 (INR 4,293) | 7% | – |
The resilience of Pune’s residential market despite several hurdles is evident from the half yearly sales of 21,613 units recording a 9% YoY growth in H2 2022. Although a sizable portion of homebuyers are recent settlers, particularly salaried workers opting for housing mortgage, their stance is nonetheless positive despite the repo-rate hikes. Meanwhile, the market saw a 6% YoY increase in the new launches in H2 2022, generating a supply of 21,247 units.

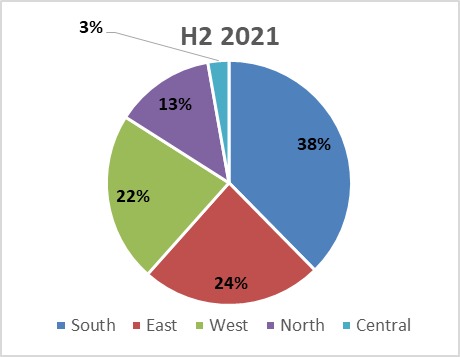
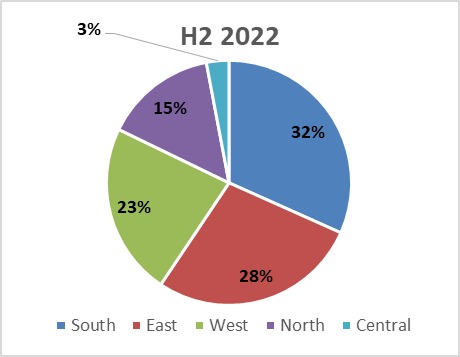
Sales volumes in H2 2022 was concentrated majorly in South, East and West zones of the city, having a share contribution of 32%, 28% and 23% respectively. New launches in Central, West, and North zones amounted to 20%, 26% and 10% of the total launches.
Micro-market split of sales in H2 2021 and H2 2022
Source: Knight Frank Research
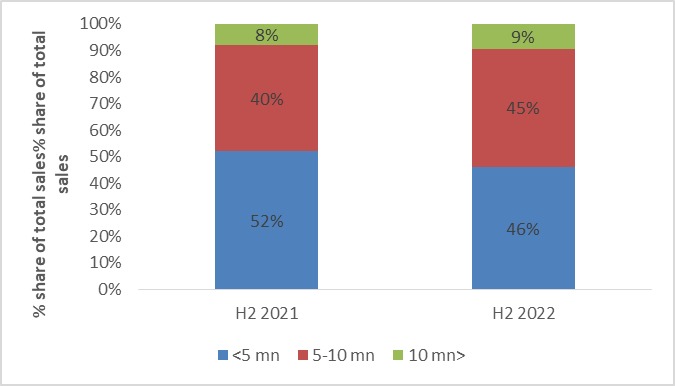
Residential sales of ticket size INR 5-10 mn recorded improvement going from 40% in H1 2021 to 45% in H2 2022 in Pune while residential sales of <INR 5 mn ticket size recorded a decline in share from 52% in H2 2021 to 46% in H2 2022. This change in share contribution can be attributed to an overall rise in the price of products. >INR 10mn properties also recorded an increase in share take up from 8% in H1 2022 to 9% H2 2022.
Pune ticket size split comparison of sales during H2 2021 and H2 2022
Source: Knight Frank Research
Residential prices have recorded a growth of 7% YoY in H2 2022. Initially, developers opted for price hikes on account of rising raw material prices. However, subsequently, they have been able to increase prices as they are supported by a strong demand. Quarter to sell (QTS) has dipped from 6.3 quarters in 2021 to 4.6 quarters in 2022 indicative of the strong market demand.
Vilas P Menon, National Director – Occupier Services, Capital Markets & Branch Head – Pune at Knight Frank India said, “The Pune residential market has recorded substantial growth over the last 2 years. With the return-to-office trend catching up, residential spaces near key employment are expected to see a rise in sales momentum. Even while Pune is a price sensitive market for residential properties as it is largely end user drive, the recent rise in demand is based on consumer confidence, financial consistence and overall economic growth.”
OFFICE MARKET HIGHLIGHTS OF PUNE
Due to the flexibility, affordability, and geographical advantages, co- working office spaces have been the most popular choice among office occupiers in Pune, where they currently account for most of the office demand. Total office transactions were recorded at 6.2 Mn sq ft a rise of 61% YoY for 2022. Though annual office completions reduced by 8% YoY in 2022at it remained commensurate to demand at 6.7 Mn sq ft .
PUNE OFFICE MARKET SUMMARY
| Parameter | 2022 | 2022
Change (YoY) |
H2 2022 | H2 2022 Change (YoY) |
| Completions in mn sq m (mn sq ft) | 0.62 (6.7) | -8% | 0.15 (1.7) | -61% |
| Transactions in mn sq m (mn sq ft) | 0.57 (6.2) | 61% | 0.26 (2.8) | 6% |
| Average transacted rent in INR/sq m/month (INR/sq ft/month) | 775 (72) | 7% |
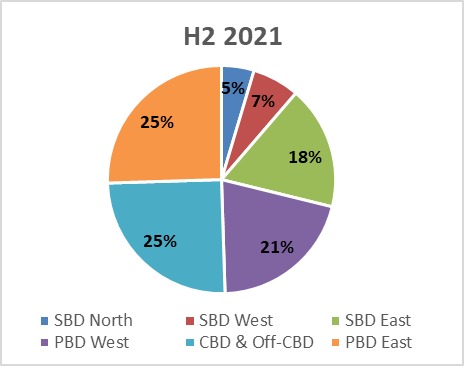
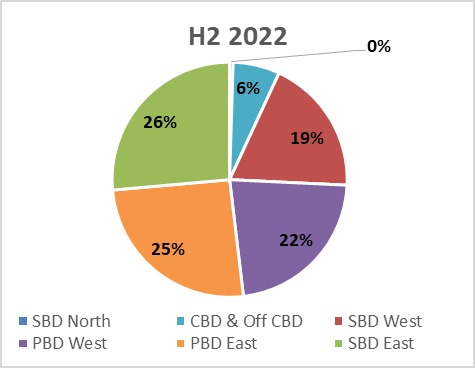
Pune recorded 2.8 mn sq ft of office space leasing in H2 2022. With micro markets like Secondary Business District (SBD) East, Peripheral Business District (PBD) east and Peripheral Business District (PBD) west driving demand amounting to 73% of the transactions in H2 2022.
SBD East recorded an increase in its share of transaction from 18% in H2 2021 to 26% in H2 2022, while SBD West recorded a jump from 7% in H2 2021 to 19% in H2 2022. PBD West also saw a minor jump in its share of transactions amounting to a rise of 1%.
Business district wise transactions split in H2 2021 and H2 2022
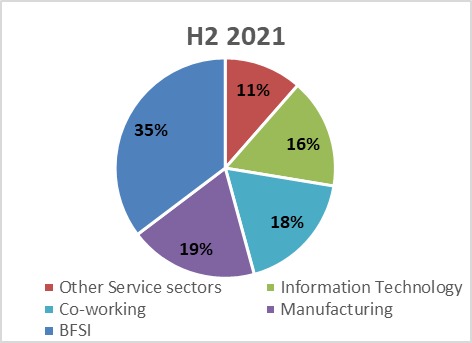
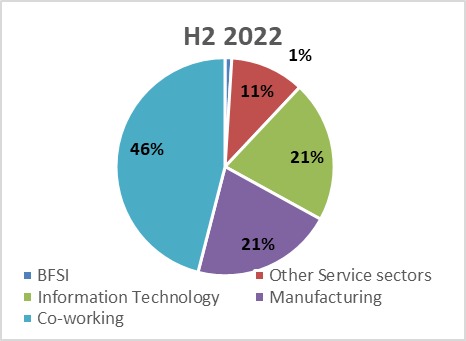
Co-working segment grew substantially as a result of rising occupier inclination towards flexibility, recording a jump in its share of transactions from 18% in H2 2021 to 46% in H2 2022. Information Technology (IT) and manufacturing sectors also recorded an uptick in their space take up in H2 2022. The IT sector recorded a jump in share take up from 16% in H2 2021 to 21% in H2 2022, while manufacturing grew from 8% in H2 2021 to 13% in H2 2022.
Sector-wise transactions split in H2 2021 and H2 2022
Residential sales of ticket size INR 5-10 mn recorded improvement going from 40% in H1 2021 to 45% in H2 2022 in Pune while residential sales of <INR 5 mn ticket size recorded a decline in share from 52% in H2 2021 to 46% in H2 2022. This change in share contribution can be attributed to an overall rise in the price of products. >INR 10mn properties also recorded an increase in share take up from 8% in H1 2022 to 9% H2 2022.
Pune ticket size split comparison of sales during H2 2021 and H2 2022
Residential prices have recorded a growth of 7% YoY in H2 2022. Initially, developers opted for price hikes on account of rising raw material prices. However, subsequently, they have been able to increase prices as they are supported by a strong demand. Quarter to sell (QTS) has dipped from 6.3 quarters in 2021 to 4.6 quarters in 2022 indicative of the strong market demand.
Vilas P Menon, National Director – Occupier Services, Capital Markets & Branch Head – Pune at Knight Frank India said, “The Pune residential market has recorded substantial growth over the last 2 years. With the return-to-office trend catching up, residential spaces near key employment are expected to see a rise in sales momentum. Even while Pune is a price sensitive market for residential properties as it is largely end user drive, the recent rise in demand is based on consumer confidence, financial consistence and overall economic growth.”
Vilas P Menon, National Director – Occupier Services, Capital Markets & Branch Head – Pune at Knight Frank India said, “Leading office demand in the Pune market, the managed office spaces have grown to be the preferred choice amongst office occupiers on account of the flexibility, cost, and spatial benefits. Steered by the co-working deals, Baner and Kharadi, saw some interesting deals and were hotspots for leasing activity in H2 2022. Several occupiers are re-evaluating expansion plans in the backdrop of global turmoil and rising interest rates.”